Edit chart
Loading graph
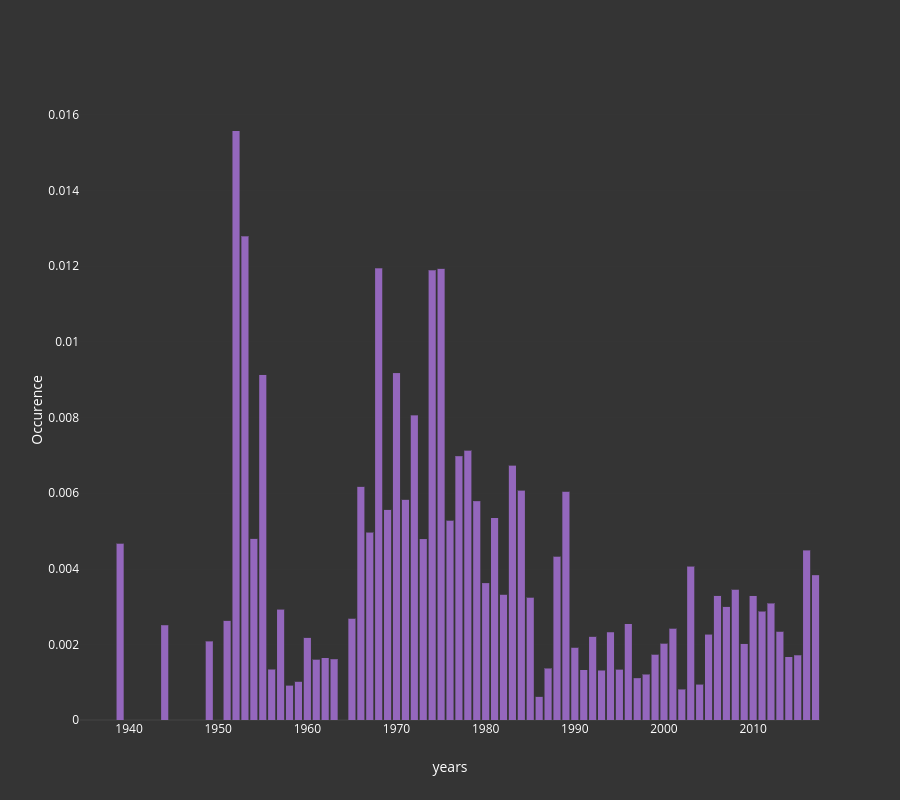
Sfa's interactive graph and data of "Occurence vs years" is a bar chart, showing Occurence; with years in the x-axis and Occurence in the y-axis.. The x-axis shows values from 1934.5 to 2017.5. The y-axis shows values from 0 to 0.016396130513198885.