Edit chart
Loading graph
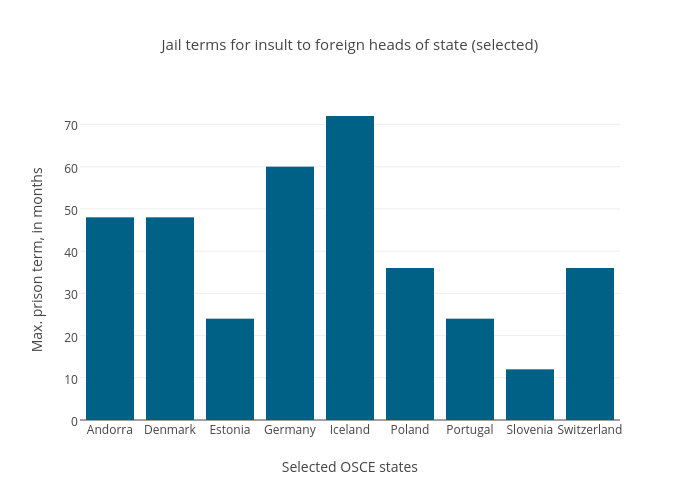
Sgriffenipi's interactive graph and data of "Jail terms for insult to foreign heads of state (selected)" is a bar chart, showing B; with Selected OSCE states in the x-axis and Max. prison term, in months in the y-axis.. The x-axis shows values from -0.5 to 8.5. The y-axis shows values from 0 to 75.78947368421052.