Edit chart
Loading graph
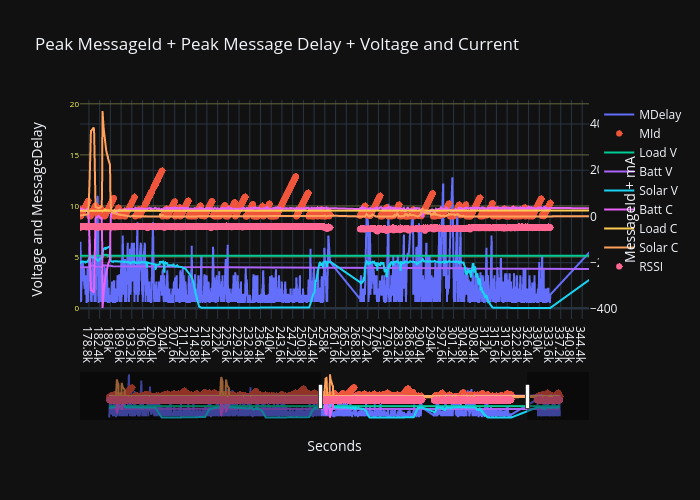
Sgtsmall's interactive graph and data of "Peak MessageId + Peak Message Delay + Voltage and Current" is a line chart, showing MDelay, MId, Load V, Batt V, Solar V, Batt C, Load C, Solar C, RSSI; with Seconds in the x-axis and Voltage and MessageDelay in the y-axis.. The x-axis shows values from 175800.4463182111 to 346683.7793960863. The y-axis shows values from -1.0722222222222222 to 20.372222222222224.