Edit chart
Loading graph
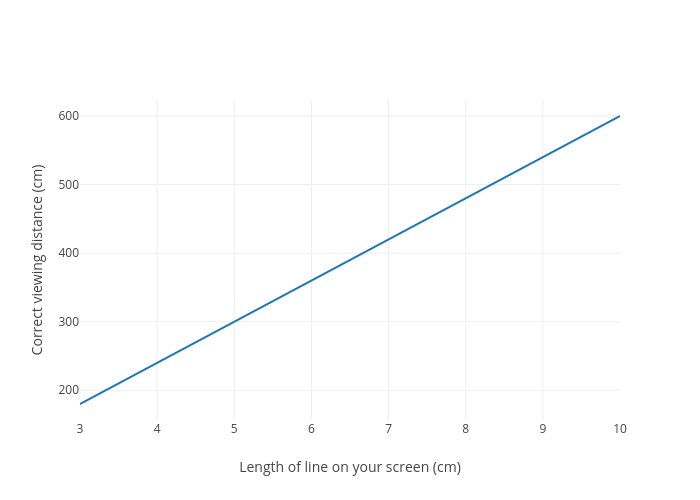
Shaggy2922's interactive graph and data of "Correct viewing distance (cm) vs Length of line on your screen (cm)" is a line chart; with Length of line on your screen (cm) in the x-axis and Correct viewing distance (cm) in the y-axis.. The x-axis shows values from 3 to 10. The y-axis shows values from 156.66666666666666 to 623.3333333333334.