Edit chart
Loading graph
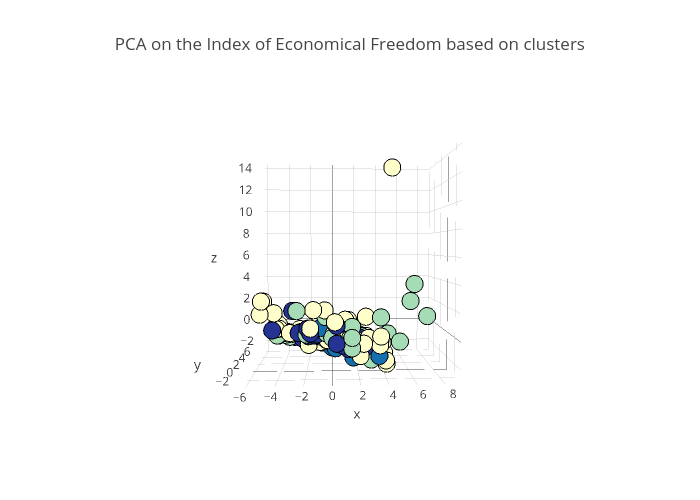
Shamanga's interactive graph and data of "PCA on the Index of Economical Freedom based on clusters" is a scatter3d, showing [3, 0, 1, 0, 1, 3, 1, 0, 0, 1, 0, 1, 3, 1, 2, 3, 2, 2, 0, 0, 0, 1, 0, 1, 1, 0, 0, 0, 0, 3, 3, 1, 1, 1, 1, 1, 1, 0, 3, 3, 3, 3, 1, 3, 1, 1, 3, 1, 0, 3, 0, 0, 0, 1, 0, 3, 3, 0, 0, 0, 0, 0, 1, 0, 3, 2, 3, 1, 0, 3, 1, 2, 0, 3, 0, 0, 0, 1, 0, 0, 2, 2, 2, 3, 3, 1, 0, 1, 0, 3, 3, 1, 1, 3, 3, 3, 1, 3, 0, 3, 0, 2, 2, 0, 3, 0, 1, 0, 1, 3, 0, 1, 0, 0, 0, 0, 0, 0, 0, 3, 0, 0, 1, 0, 3, 1, 1, 0, 0]. The x-axis shows values from 0 to 0. The y-axis shows values from 0 to 0.