Edit chart
Loading graph
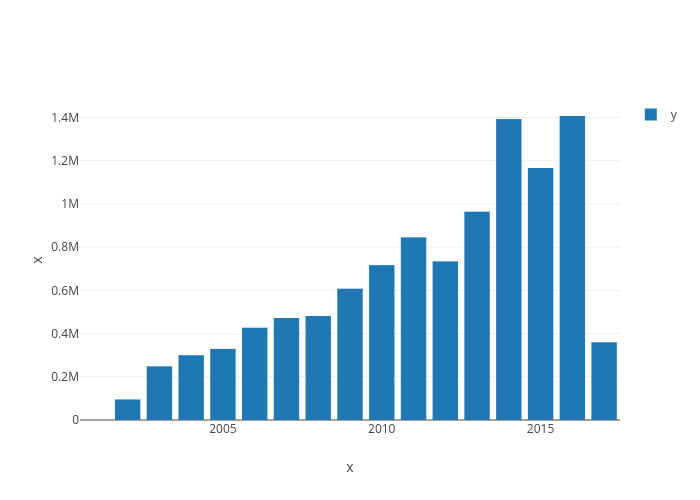
Shashank-sharma's interactive graph and data of "x vs x" is a bar chart, showing y; with x in the x-axis and x in the y-axis.. The x-axis shows values from 2000.5 to 2017.5. The y-axis shows values from 0 to 1480844.2105263157.