Edit chart
Loading graph
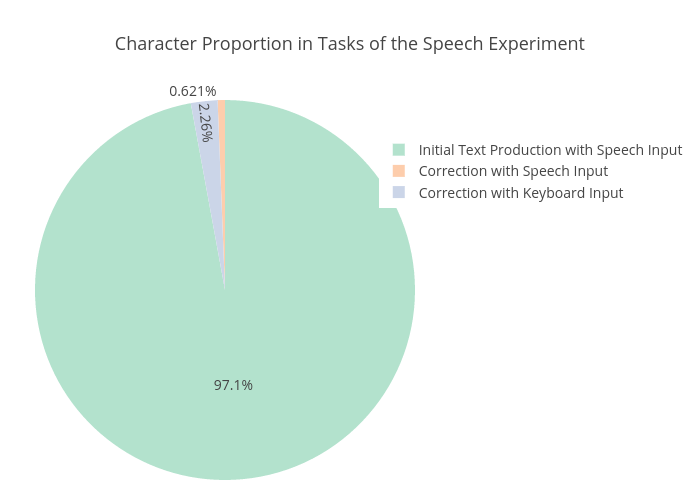
Sherryruan's interactive graph and data of " Character Proportion in Tasks of the Speech Experiment " is a pie, showing Col2. The x-axis shows values from 0 to 0. The y-axis shows values from 0 to 0.