Edit chart
Loading graph
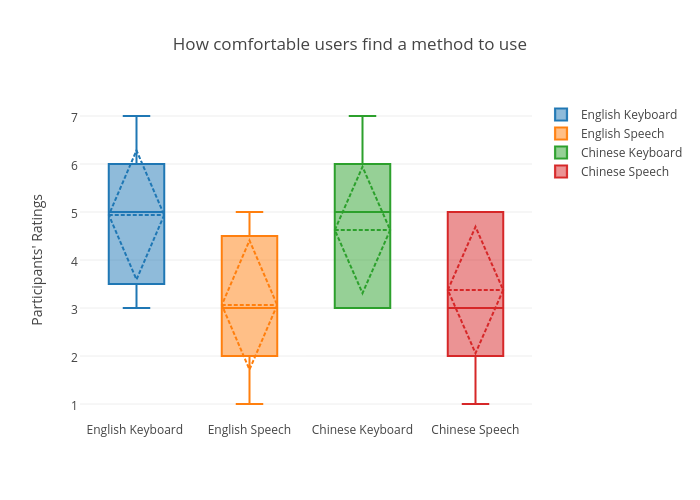
Sherryruan's interactive graph and data of "How comfortable users find a method to use" is a box plot, showing English Keyboard , English Speech, Chinese Keyboard, Chinese Speech; with Participants' Ratings in the y-axis. The x-axis shows values from -0.5 to 3.5. The y-axis shows values from 0.6666666666666667 to 7.333333333333333.