Edit chart
Loading graph
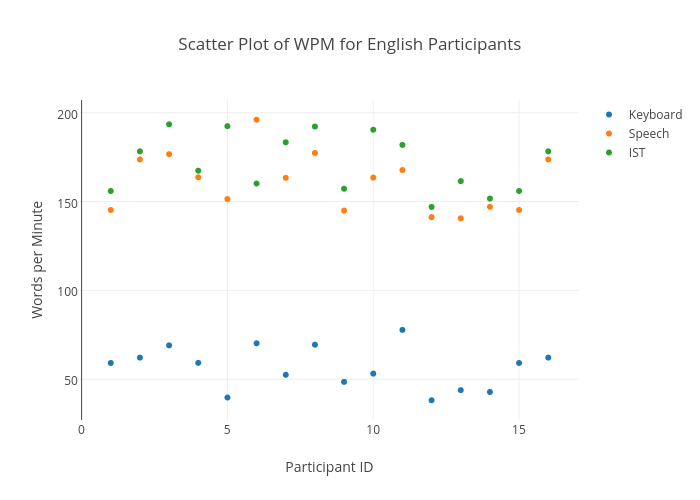
Sherryruan's interactive graph and data of "Scatter Plot of WPM for English Participants" is a scatter chart, showing Keyboard, Speech, IST; with Participant ID in the x-axis and Words per Minute in the y-axis.. The x-axis shows values from 0.06626506024096379 to 16.933734939759034. The y-axis shows values from 26.88795022624435 to 207.32604977375564.