Edit chart
Loading graph
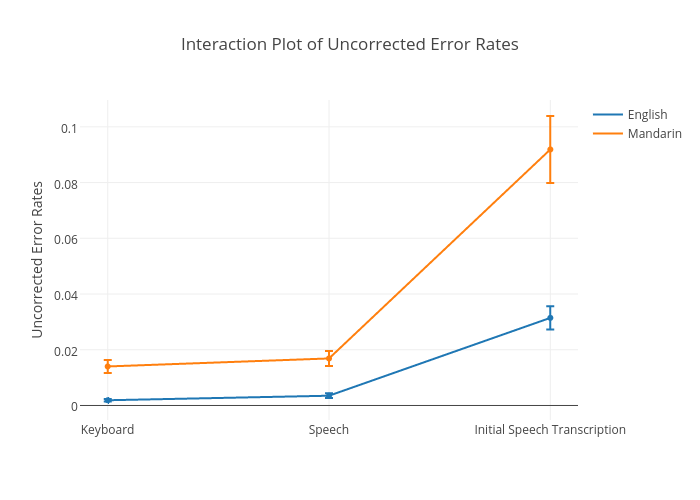
Sherryruan's interactive graph and data of "Interaction Plot of Uncorrected Error Rates" is a line chart, showing English, A, Mandarin, D; with Uncorrected Error Rates in the y-axis. The x-axis shows values from -0.12521150592216582 to 2.125. The y-axis shows values from -0.0052927988232013366 to 0.1096195315170106.