Edit chart
Loading graph
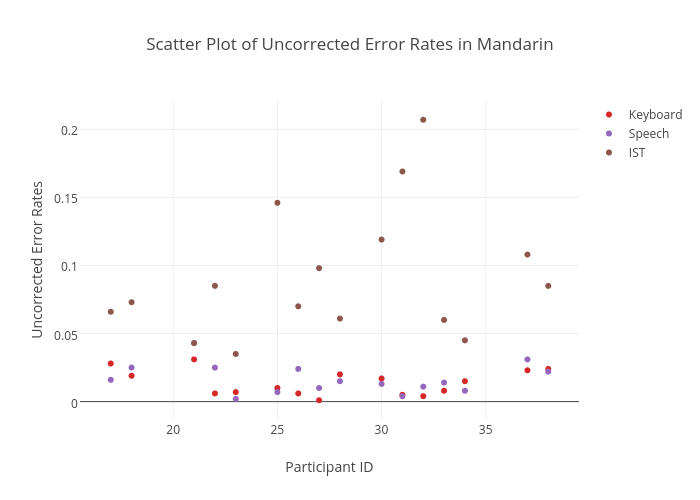
Sherryruan's interactive graph and data of "Scatter Plot of Uncorrected Error Rates in Mandarin" is a scatter chart, showing Keyboard, Speech, IST; with Participant ID in the x-axis and Uncorrected Error Rates in the y-axis.. The x-axis shows values from 15.683221821924858 to 39.31677817807514. The y-axis shows values from -0.013680995475113117 to 0.2216809954751131.