Edit chart
Loading graph
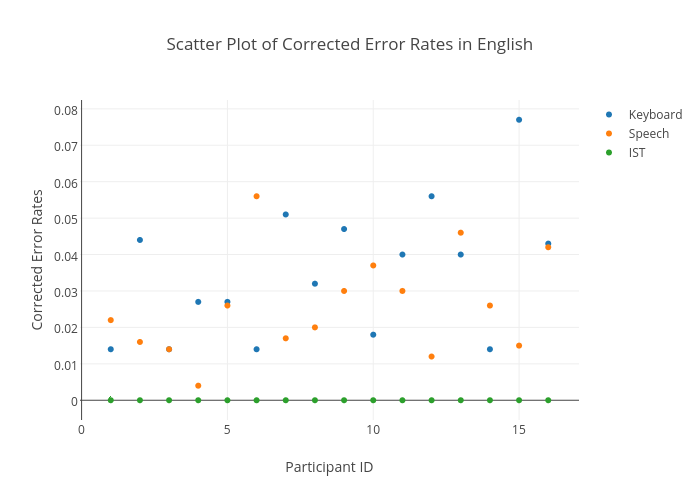
Sherryruan's interactive graph and data of "Scatter Plot of Corrected Error Rates in English" is a scatter chart, showing Keyboard, Speech, IST; with Participant ID in the x-axis and Corrected Error Rates in the y-axis.. The x-axis shows values from 0.059444158517756085 to 16.940555841482244. The y-axis shows values from -0.005487556561085971 to 0.08248755656108597.