Edit chart
Loading graph
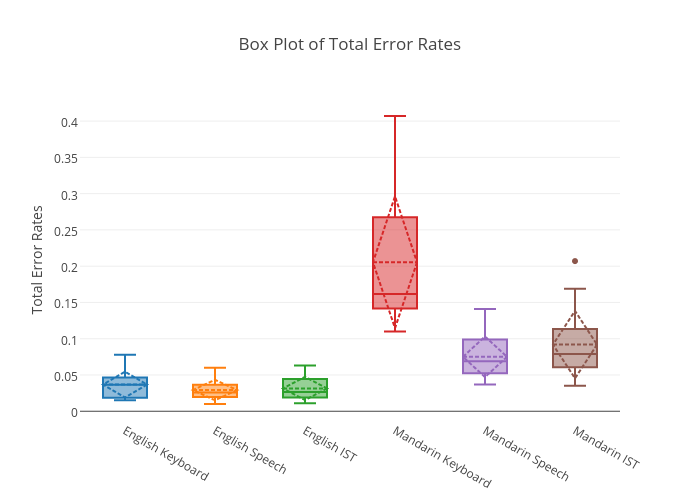
Sherryruan's interactive graph and data of "Box Plot of Total Error Rates" is a box plot, showing English Keyboard, English Speech, English IST, Mandarin Keyboard, Mandarin Speech, Mandarin IST; with Total Error Rates in the y-axis. The x-axis shows values from -0.5 to 5.5. The y-axis shows values from -0.01205555555555555 to 0.4290555555555555.