Edit chart
Loading graph
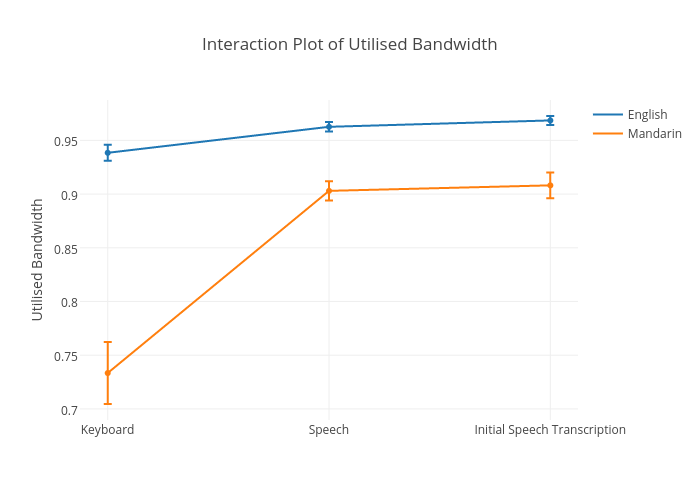
Sherryruan's interactive graph and data of "Interaction Plot of Utilised Bandwidth" is a line chart, showing English, A, Mandarin, D; with Utilised Bandwidth in the y-axis. The x-axis shows values from -0.12521150592216582 to 2.125. The y-axis shows values from 0.689665695611111 to 0.987594103388889.