Edit chart
Loading graph
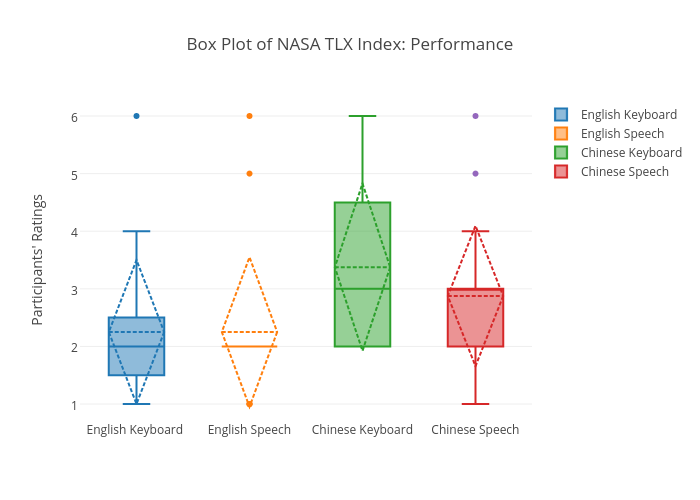
Sherryruan's interactive graph and data of "Box Plot of NASA TLX Index: Performance" is a box plot, showing English Keyboard , English Speech, Chinese Keyboard, Chinese Speech; with Participants' Ratings in the y-axis. The x-axis shows values from -0.5 to 3.5. The y-axis shows values from 0.7222222222222223 to 6.277777777777778.