Edit chart
Loading graph
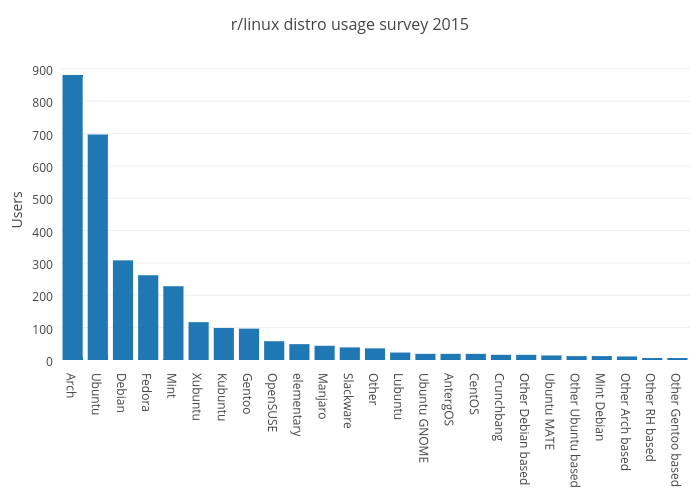
Shevchuk's interactive graph and data of "r/linux distro usage survey 2015" is a bar chart, showing Users; with in the x-axis and Users in the y-axis.. The x-axis shows values from -0.5 to 24.5. The y-axis shows values from 0 to 927.3684210526316.