Edit chart
Loading graph
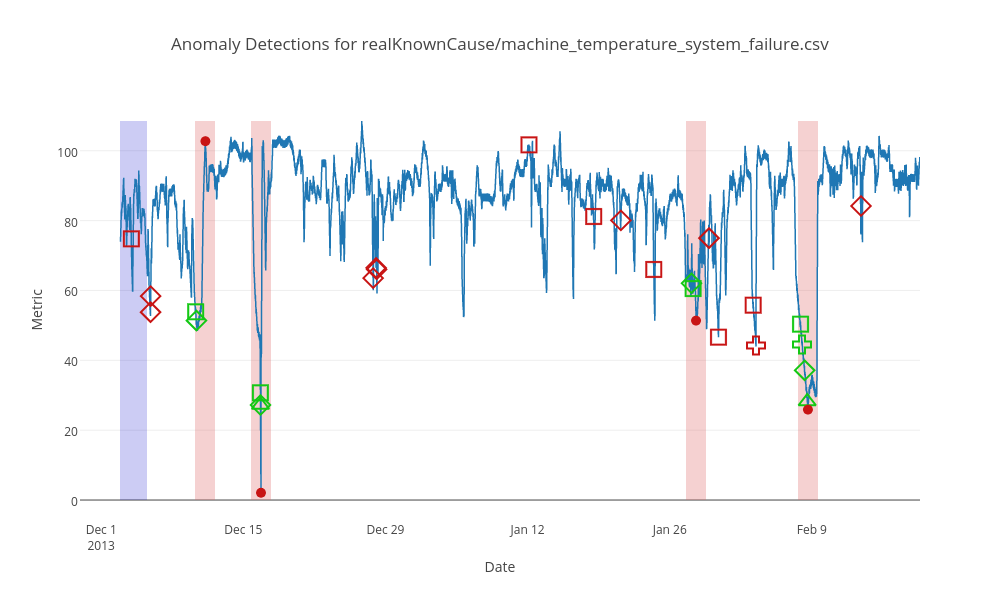
Sjd171's interactive graph and data of "Anomaly Detections for realKnownCause/machine_temperature_system_failure.csv" is a scatter chart, showing Value, Detection by numenta, Detection by numenta, Detection by prelert, Detection by prelert, Detection by skyline, Detection by skyline, Detection by twitterADVec, Detection by twitterADVec, Detection by null, Detection by null, Ground Truth Anomaly, Anomaly Window, Probationary Period; with Date in the x-axis and Metric in the y-axis.. The x-axis shows values from 0 to 0. The y-axis shows values from 0 to 0.