Edit chart
Loading graph
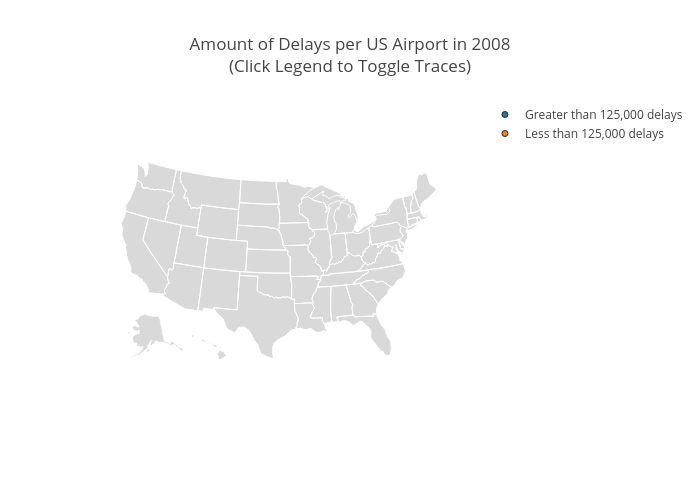
Skenny's interactive graph and data of "Amount of Delays per US Airport in 2008(Click Legend to Toggle Traces)" is a scattergeo, showing Greater than 125,000 delays vs Less than 125,000 delays. The x-axis shows values from 0 to 0. The y-axis shows values from 0 to 0.