Edit chart
Loading graph
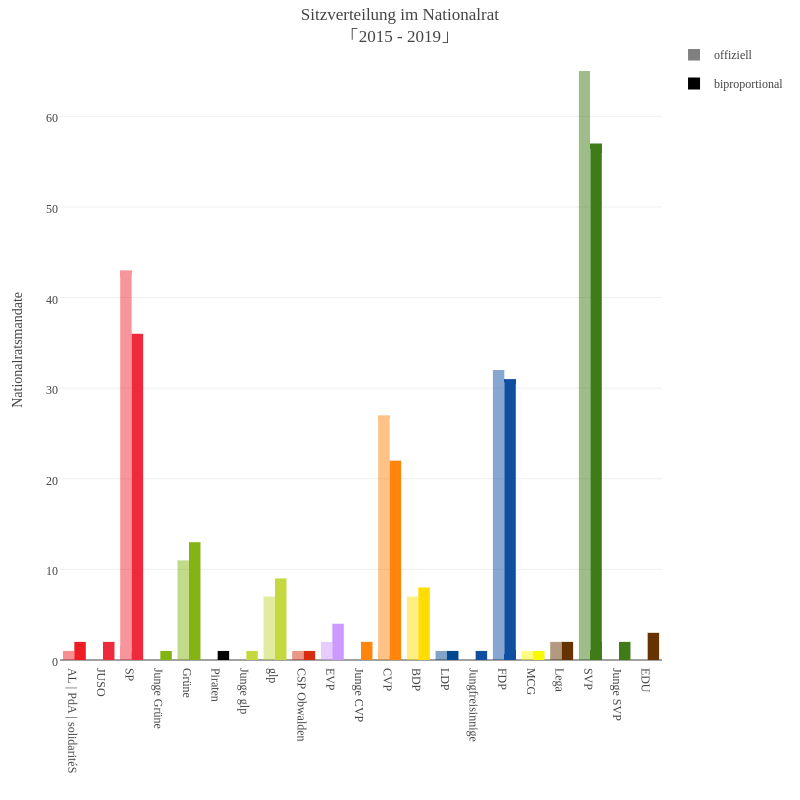
Slim-b's interactive graph and data of "Sitzverteilung im Nationalrat「2015 - 2019」" is a bar chart, showing offiziell vs biproportional; with Nationalratsmandate in the y-axis. The x-axis shows values from 0 to 0. The y-axis shows values from 0 to 0.