Edit chart
Loading graph
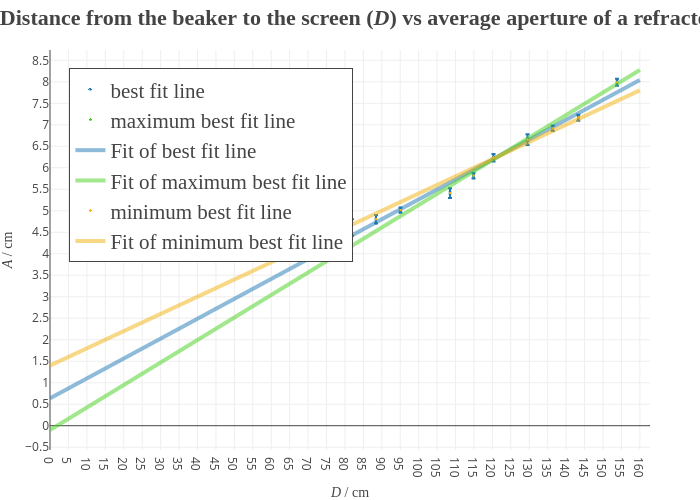
Slopez77's interactive graph and data of "Graph 1: Distance from the beaker to the screen (D) vs average aperture of a refracted ray (A)" is a scatter chartwith vertical error bars, showing best fit line, maximum best fit line, Fit of best fit line, Fit of maximum best fit line, minimum best fit line; with D / cm in the x-axis and A / cm in the y-axis.. The x-axis shows values from 0 to 162.4307233901672. The y-axis shows values from -0.5652575028758553 to 8.739892554641251.