Edit chart
Loading graph
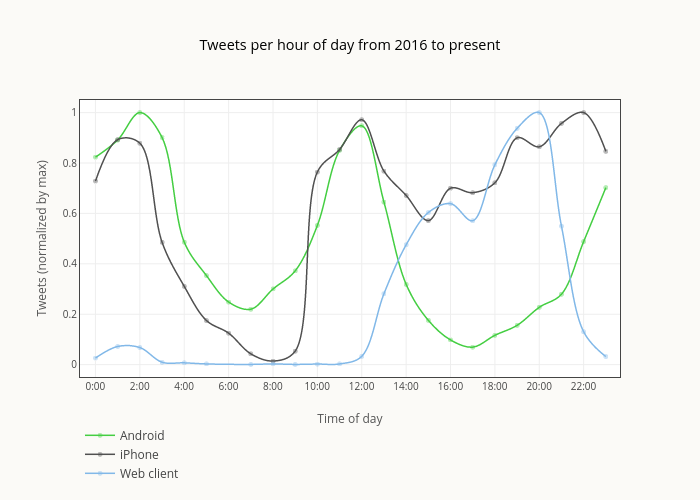
Smith-erik's interactive graph and data of "Tweets per hour of day from 2016 to present " is a line chart, showing Android, iPhone, Web client; with Time of day in the x-axis and Tweets (normalized by max) in the y-axis.. The x-axis shows values from -0.6982142857142859 to 23.637976190476188. The y-axis shows values from -0.048996655518394654 to 1.0499522216913522.