Edit chart
Loading graph
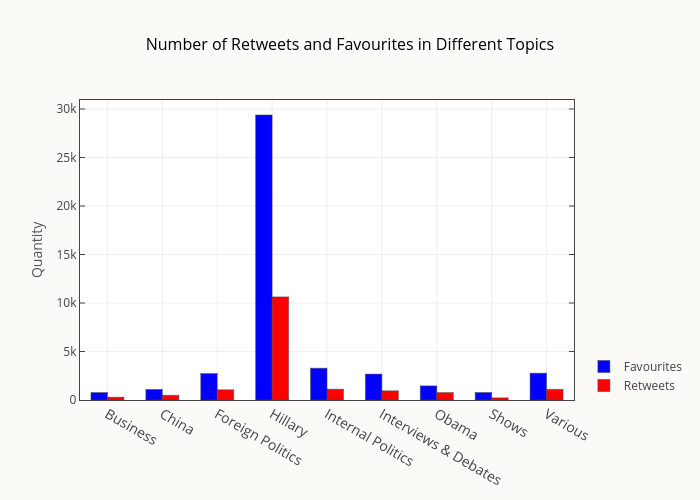
Smith-erik's interactive graph and data of "Number of Retweets and Favourites in Different Topics" is a bar chart, showing Favourites vs Retweets; with Quantity in the y-axis. The x-axis shows values from -0.5 to 8.5. The y-axis shows values from 0 to 30928.24724602203.