Edit chart
Loading graph
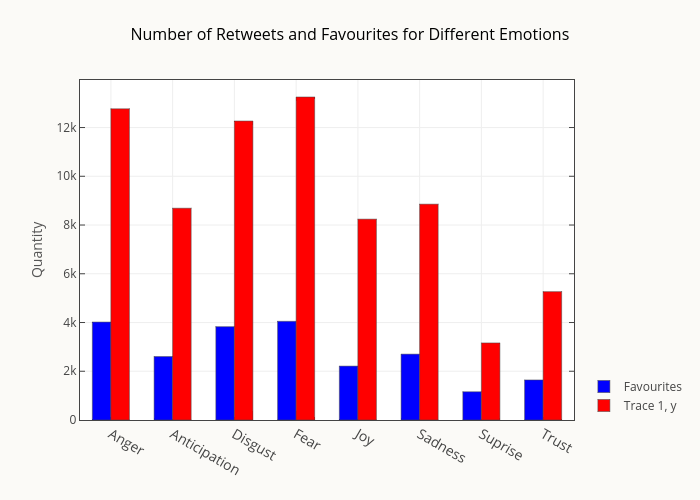
Smith-erik's interactive graph and data of "Number of Retweets and Favourites for Different Emotions" is a bar chart, showing Favourites vs Trace 1, y; with in the x-axis and Quantity in the y-axis.. The x-axis shows values from -0.5 to 7.5. The y-axis shows values from 0 to 13949.965841306526.