Edit chart
Loading graph
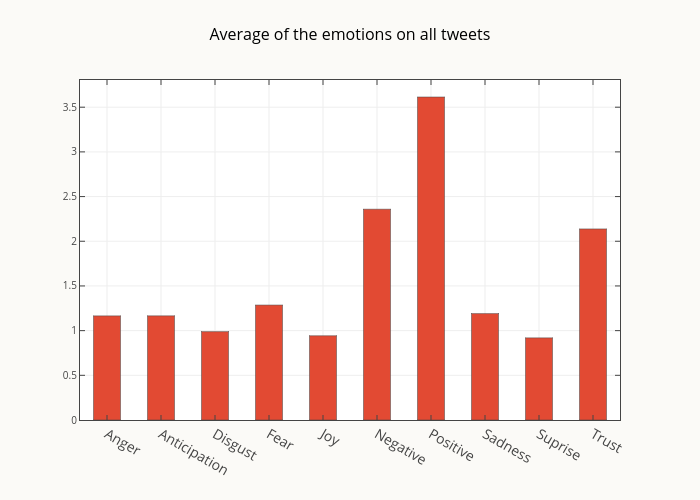
Smith-erik's interactive graph and data of "Average of the emotions on all tweets" is a bar chart, showing y. The x-axis shows values from -0.5 to 9.5. The y-axis shows values from 0 to 3.804298511572314.