Edit chart
Loading graph
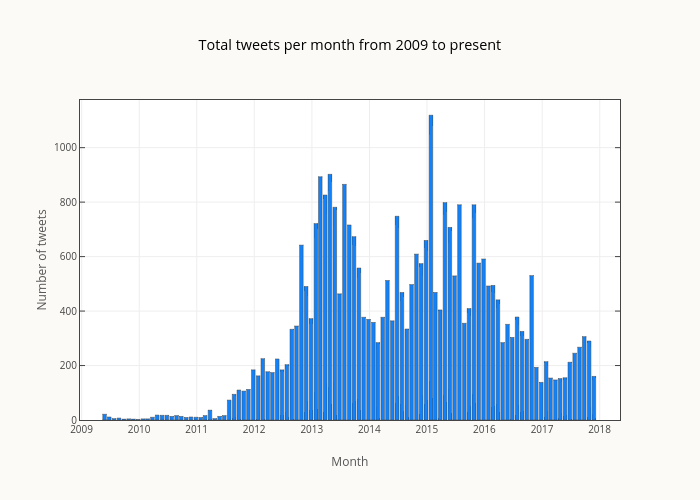
Smith-erik's interactive graph and data of "Total tweets per month from 2009 to present" is a bar chart; with Month in the x-axis and Number of tweets in the y-axis.. The x-axis shows values from 2008-12-21 06:00:00 to 2018-05-09 18:00:00. The y-axis shows values from 0 to 1174.95.