Edit chart
Loading graph
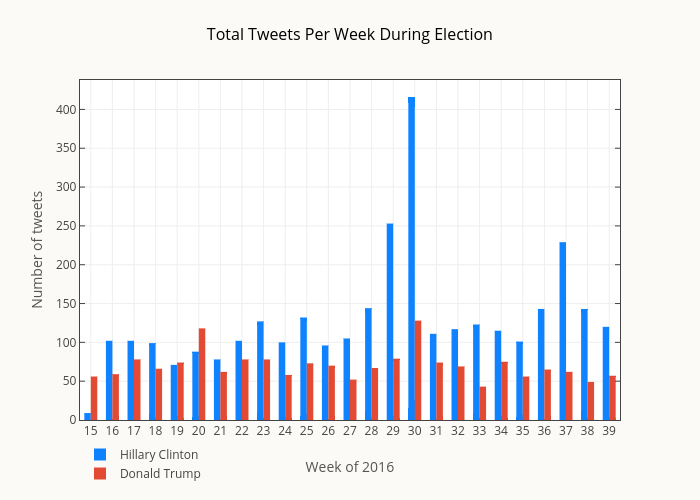
Smith-erik's interactive graph and data of "Total Tweets Per Week During Election" is a grouped bar chart, showing Hillary Clinton vs Donald Trump; with Week of 2016 in the x-axis and Number of tweets in the y-axis.. The x-axis shows values from 14.5 to 39.5. The y-axis shows values from 0 to 437.89473684210526.