Edit chart
Loading graph
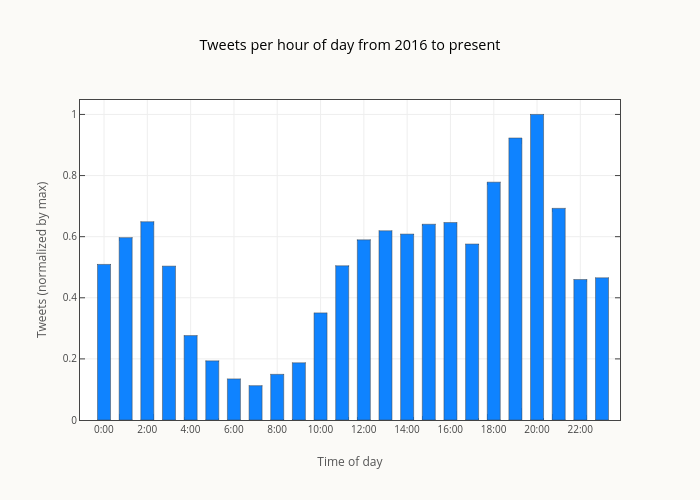
Smith-erik's interactive graph and data of "Tweets per hour of day from 2016 to present " is a bar chart; with Time of day in the x-axis and Tweets (normalized by max) in the y-axis.. The x-axis shows values from -1.1091428571428574 to 23.831. The y-axis shows values from 0 to 1.0472513089005235.