Edit chart
Loading graph
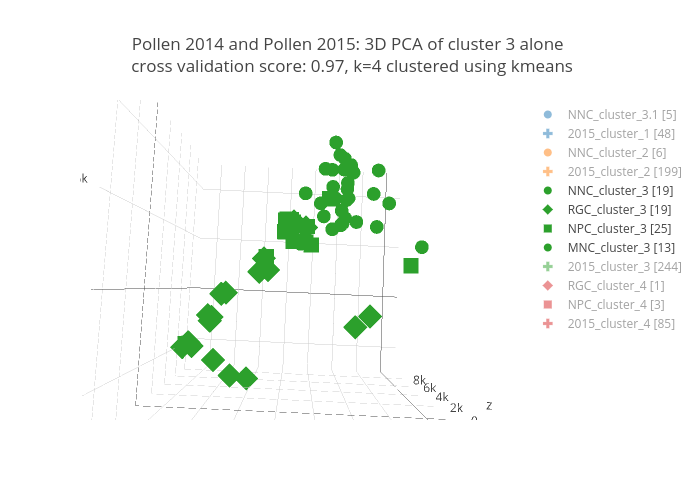
Smplbio's interactive graph and data of "Pollen 2014 and Pollen 2015: 3D PCA of cluster 3 alone cross validation score: 0.97, k=4 clustered using kmeans" is a scatter3d, showing NNC_cluster_3.1 [5], RGC_cluster_1 [0], NPC_cluster_1 [0], MNC_cluster_1 [0], 2015_cluster_1 [48], NNC_cluster_2 [6], RGC_cluster_2 [0], NPC_cluster_2 [0], MNC_cluster_2 [0], 2015_cluster_2 [199], NNC_cluster_3 [19], RGC_cluster_3 [19], NPC_cluster_3 [25], MNC_cluster_3 [13], 2015_cluster_3 [244], NNC_cluster_4 [0], RGC_cluster_4 [1], NPC_cluster_4 [3], MNC_cluster_4 [0], 2015_cluster_4 [85]; with component 1 in the x-axis and component 2 in the y-axis.. The x-axis shows values from 0 to 0. The y-axis shows values from 0 to 0.