Edit chart
Loading graph
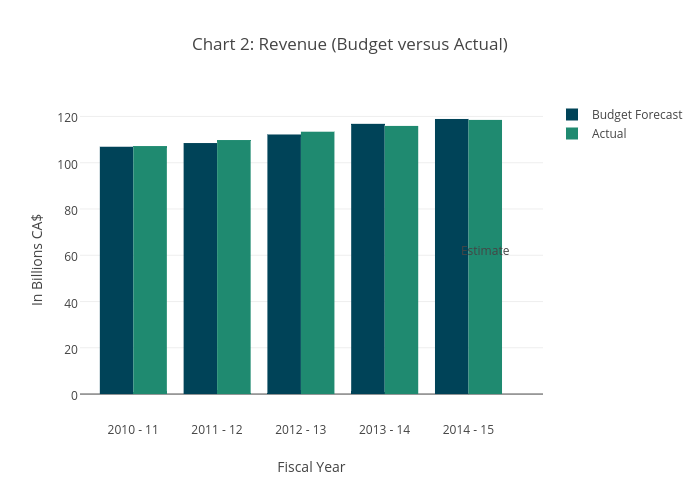
Soctaviani's interactive graph and data of "Chart 2: Revenue (Budget versus Actual)" is a bar chart, showing Budget Forecast vs Actual; with Fiscal Year in the x-axis and In Billions CA$ in the y-axis.. The x-axis shows values from -0.6366517589895362 to 4.889202831388703. The y-axis shows values from -11.21587872302969 to 127.10498670770133. This visualization has the following annotation: Estimate