Edit chart
Loading graph
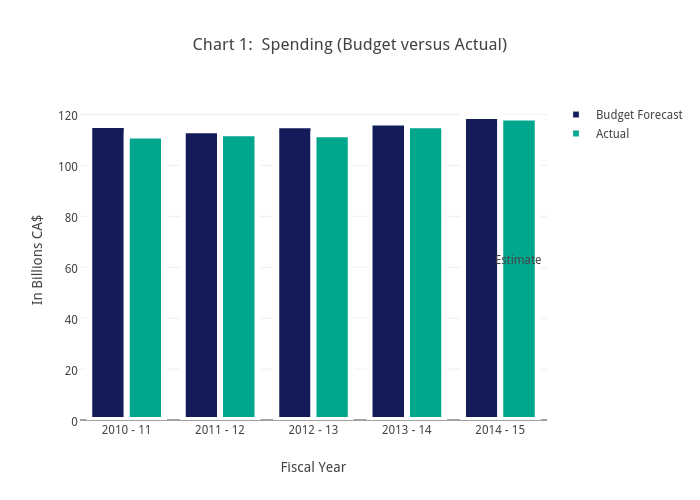
Soctaviani's interactive graph and data of "Chart 1: Spending (Budget versus Actual)" is a bar chart, showing Budget Forecast vs Actual; with Fiscal Year in the x-axis and In Billions CA$ in the y-axis.. The x-axis shows values from -0.5 to 4.5. The y-axis shows values from 0 to 125.6842105263158. This visualization has the following annotation: Estimate