Edit chart
Loading graph
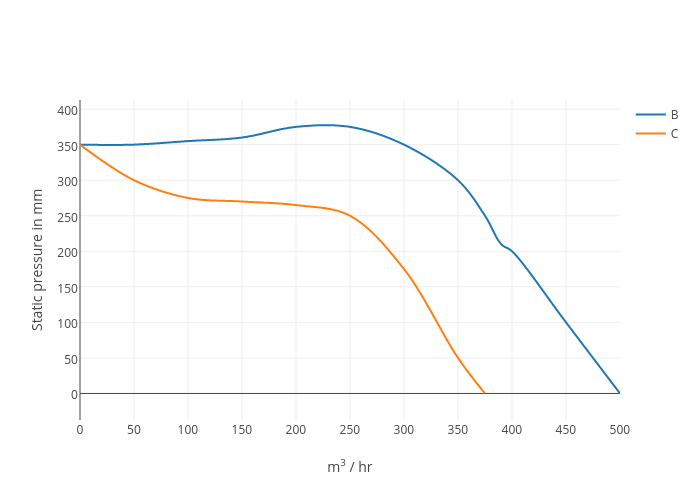
Southernmagnetics.com's interactive graph and data of "Static pressure in mm vs m3 / hr" is a line chart, showing B vs C; with m3 / hr in the x-axis and Static pressure in mm in the y-axis.. The x-axis shows values from 0 to 500. The y-axis shows values from -37.330316742081436 to 412.81088992305905.