Edit chart
Loading graph
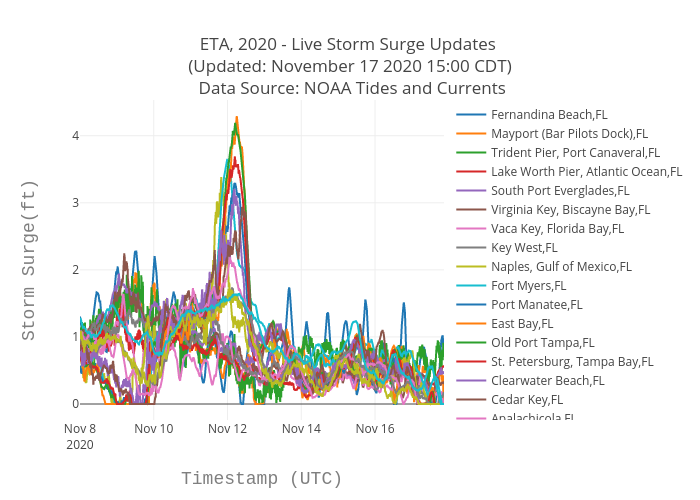
Srcc2020's interactive graph and data of "ETA, 2020 - Live Storm Surge Updates (Updated: November 17 2020 15:00 CDT) Data Source: NOAA Tides and Currents" is a scatter chart, showing Fernandina Beach,FL, Mayport (Bar Pilots Dock),FL, Trident Pier, Port Canaveral,FL, Lake Worth Pier, Atlantic Ocean,FL, South Port Everglades,FL, Virginia Key, Biscayne Bay,FL, Vaca Key, Florida Bay,FL, Key West,FL, Naples, Gulf of Mexico,FL, Fort Myers,FL, Port Manatee,FL, East Bay,FL, Old Port Tampa,FL, St. Petersburg, Tampa Bay,FL, Clearwater Beach,FL, Cedar Key,FL, Apalachicola,FL, Panama City,FL, Panama City Beach,FL, Pensacola,FL; with Timestamp (UTC) in the x-axis and Storm Surge(ft) in the y-axis.. The x-axis shows values from 0 to 0. The y-axis shows values from 0 to 0.