Edit chart
Loading graph
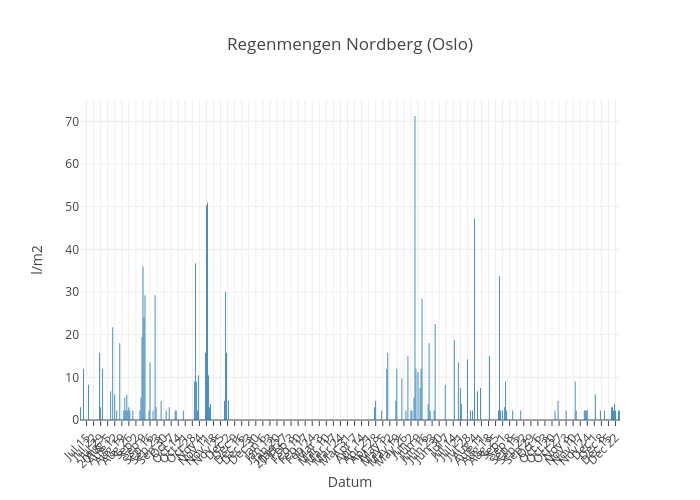
Srothe's interactive graph and data of "Regenmengen Nordberg (Oslo)" is a bar chart; with Datum in the x-axis and l/m2 in the y-axis.. The x-axis shows values from 0 to 0. The y-axis shows values from 0 to 0.