Edit chart
Loading graph
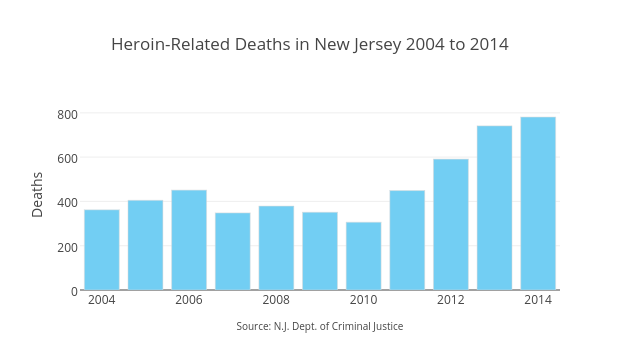
Sstirling's interactive graph and data of "Heroin-Related Deaths in New Jersey 2004 to 2014" is a bar chart, showing Col2; with Source: N.J. Dept. of Criminal Justice in the x-axis and Deaths in the y-axis.. The x-axis shows values from 2003.5 to 2014.5. The y-axis shows values from 0 to 857.9036689992556.