Edit chart
Loading graph
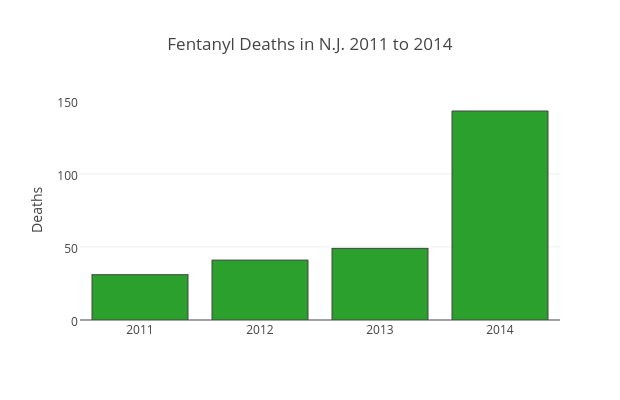
Sstirling's interactive graph and data of "Fentanyl Deaths in N.J. 2011 to 2014" is a bar chart, showing Col2; with Deaths in the y-axis. The x-axis shows values from 2010.5 to 2014.5. The y-axis shows values from 0 to 150.52631578947367.