Edit chart
Loading graph
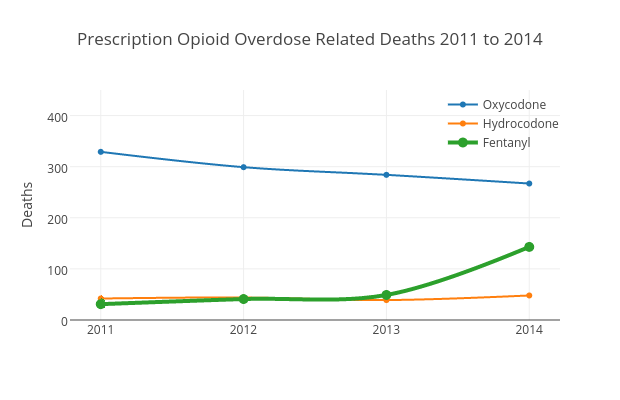
Sstirling's interactive graph and data of "Prescription Opioid Overdose Related Deaths 2011 to 2014" is a scatter chart, showing Oxycodone, Hydrocodone, Fentanyl; with Deaths in the y-axis. The x-axis shows values from 2010.7847141190198 to 2014.2152858809802. The y-axis shows values from 0 to 450.