Edit chart
Loading graph
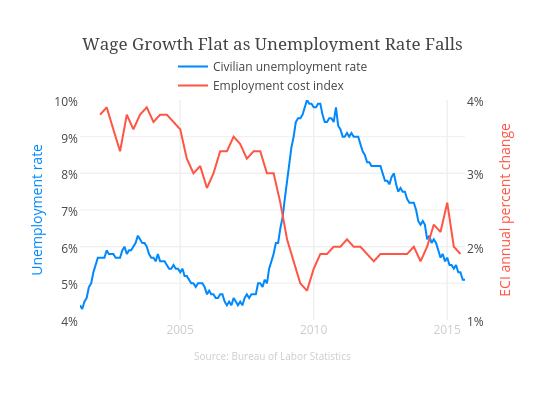
Stacyannj's interactive graph and data of "Wage Growth Flat as Unemployment Rate Falls" is a scatter chart, showing Employment cost index vs Civilian unemployment rate; with Source: Bureau of Labor Statistics in the x-axis and Unemployment rate in the y-axis.. The x-axis shows values from 986101200000 to 1441080000000. The y-axis shows values from 4 to 10.