Edit chart
Loading graph
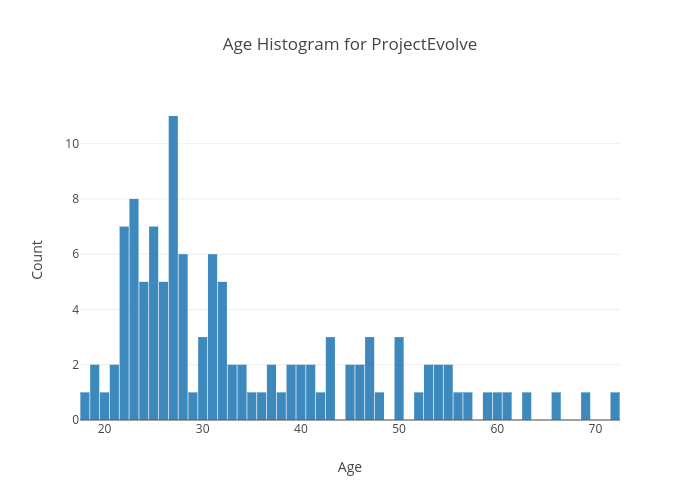
Stanleychris2's interactive graph and data of "Age Histogram for ProjectEvolve" is a histogram, showing x; with Age in the x-axis and Count in the y-axis.. The x-axis shows values from 17.5 to 72.5. The y-axis shows values from 0 to 11.578947368421053.