Edit chart
Loading graph
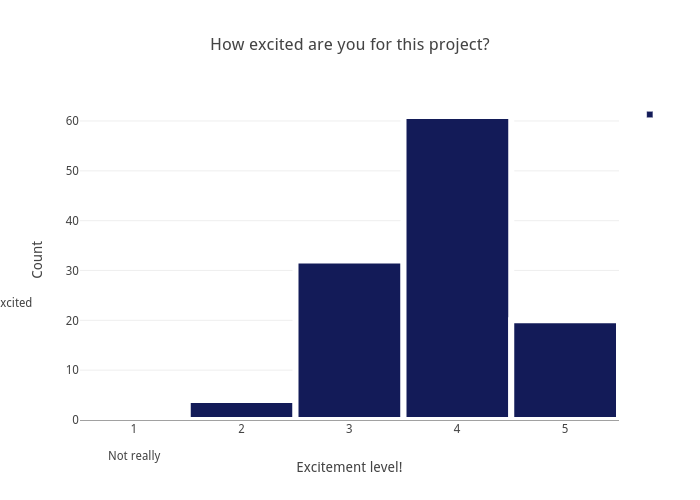
Stanleychris2's interactive graph and data of "How excited are you for this project? " is a histogram, showing ; with Excitement level! in the x-axis and Count in the y-axis.. The x-axis shows values from 0.5 to 5.5. The y-axis shows values from 0 to 64.21052631578948. This visualization has the following annotations: Not really; Very Excited