Edit chart
Loading graph
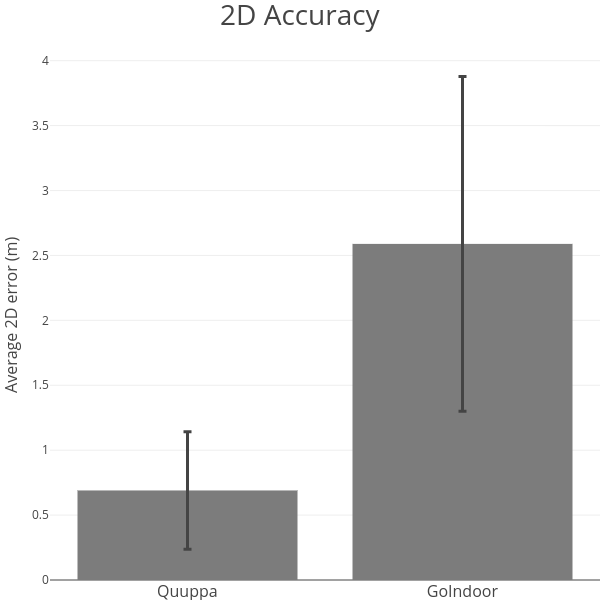
Stefand's interactive graph and data of "2D Accuracy" is a bar chartwith vertical error bars; with Average 2D error (m) in the y-axis. The x-axis shows values from -0.5 to 1.5. The y-axis shows values from 0 to 4.08228321420541.