Edit chart
Loading graph
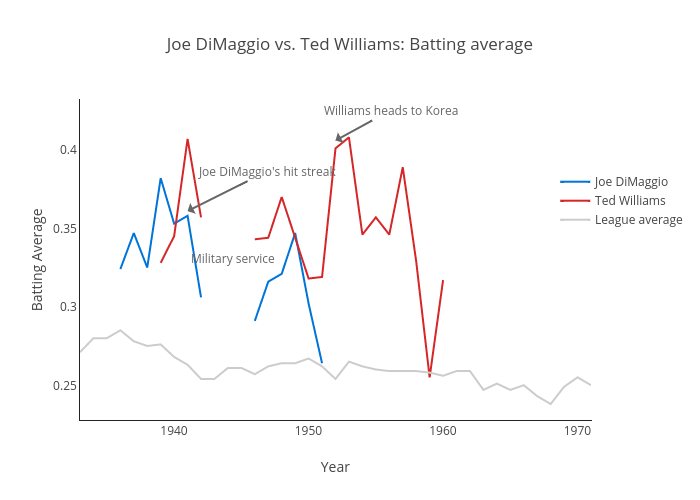
Storybench's interactive graph and data of "Joe DiMaggio vs. Ted Williams: Batting average" is a line chart, showing Joe DiMaggio, Ted Williams, League average; with Year in the x-axis and Batting Average in the y-axis.. The x-axis shows values from 1933 to 1971. The y-axis shows values from 0.22693548387096774 to 0.42822580645161296. This visualization has the following annotations: Military service; Williams heads to Korea; Joe DiMaggio's hit streak