Edit chart
Loading graph
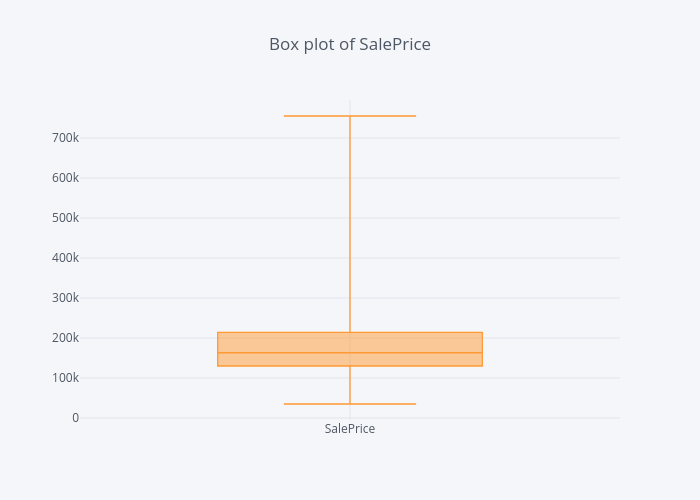
Susanli2005's interactive graph and data of "Box plot of SalePrice" is a box plot, showing SalePrice. The x-axis shows values from -0.5 to 0.5. The y-axis shows values from -5105.555555555555 to 795005.5555555555.