Edit chart
Loading graph
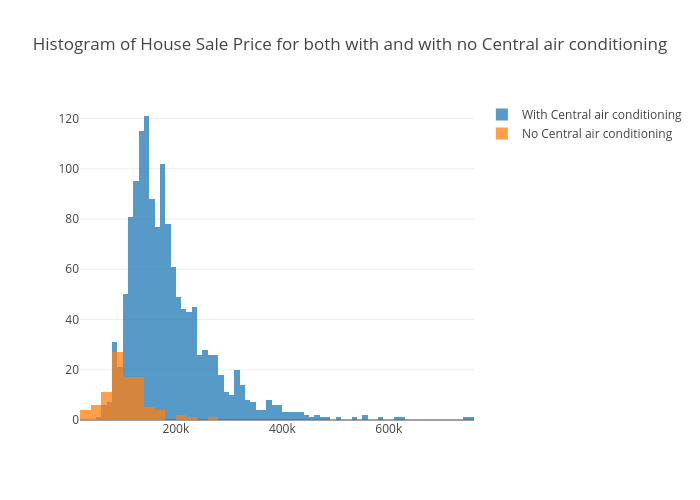
Susanli2005's interactive graph and data of "Histogram of House Sale Price for both with and with no Central air conditioning" is a histogram, showing With Central air conditioning vs No Central air conditioning. The x-axis shows values from 19999.5 to 759999.5. The y-axis shows values from 0 to 127.36842105263158.