Edit chart
Loading graph
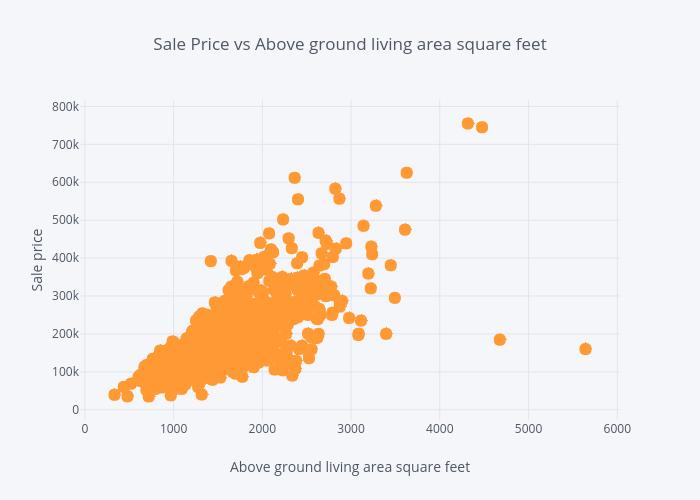
Susanli2005's interactive graph and data of "Sale Price vs Above ground living area square feet" is a scatter chart, showing SalePrice; with Above ground living area square feet in the x-axis and Sale price in the y-axis.. The x-axis shows values from -37.40390935824263 to 6013.403909358242. The y-axis shows values from -60979.236499068895 to 850879.2364990689.