Edit chart
Loading graph
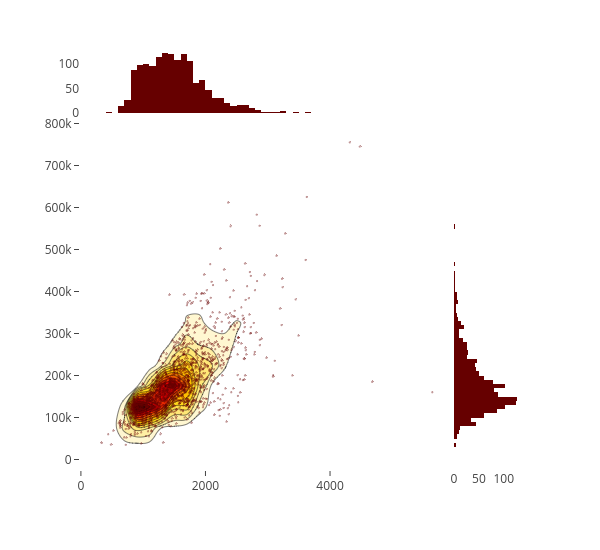
Susanli2005's interactive graph and data of "points, density, Ground Living area density, Sale Price density" is a scatter chart, showing points, density, Ground Living area density, Sale Price density. The x-axis shows values from -14.407743496672708 to 5990.407743496673. The y-axis shows values from -25000.5 to 824999.5.