Edit chart
Loading graph
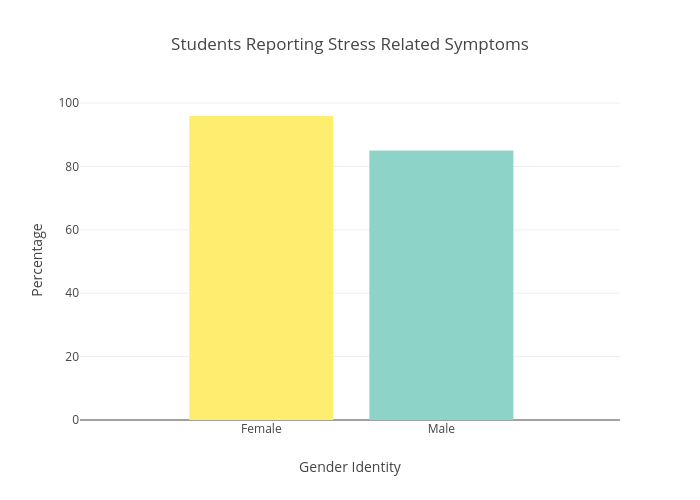
Sverma1's interactive graph and data of "Students Reporting Stress Related Symptoms" is a bar chart; with Gender Identity in the x-axis and Percentage in the y-axis.. The x-axis shows values from -0.007523939808481539 to 2.9924760601915183. The y-axis shows values from 0 to 100.94736842105264.