Edit chart
Loading graph
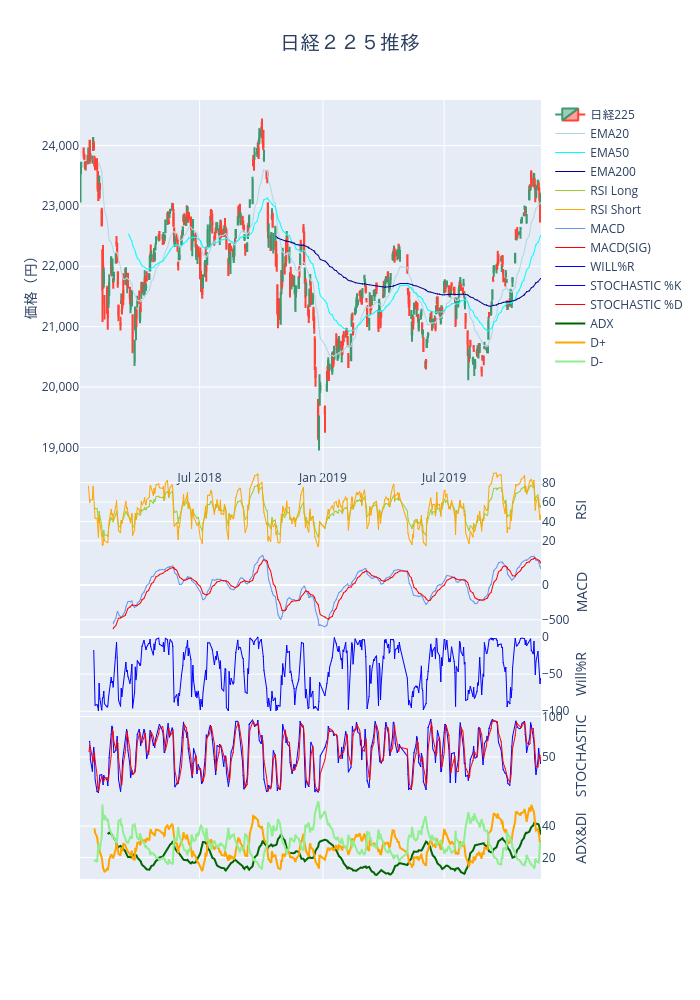
Tak.akashi's interactive graph and data of "日経225推移" is a candlestick, showing 日経225, EMA20, EMA50, EMA200, RSI Long, RSI Short, MACD, MACD(SIG), WILL%R, STOCHASTIC %K, STOCHASTIC %D, ADX, D+, D-; with 価格(円) in the y-axis. The x-axis shows values from 0 to 0. The y-axis shows values from 0 to 0.