Edit chart
Loading graph
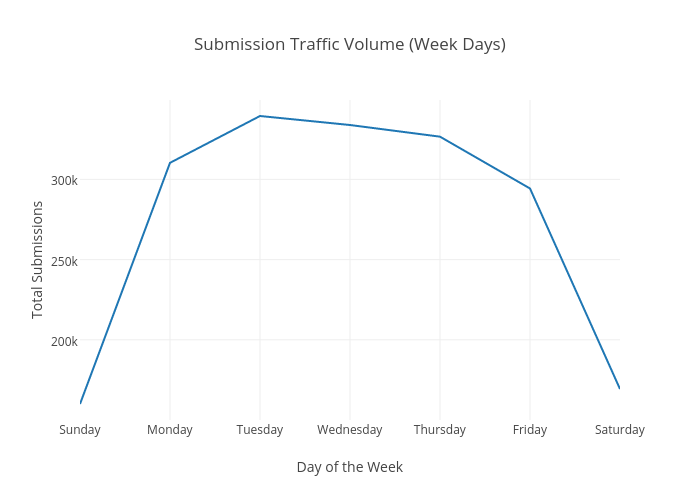
Takanori's interactive graph and data of "Submission Traffic Volume (Week Days)" is a line chart; with Day of the Week in the x-axis and Total Submissions in the y-axis.. The x-axis shows values from 0 to 0. The y-axis shows values from 0 to 0.