Edit chart
Loading graph
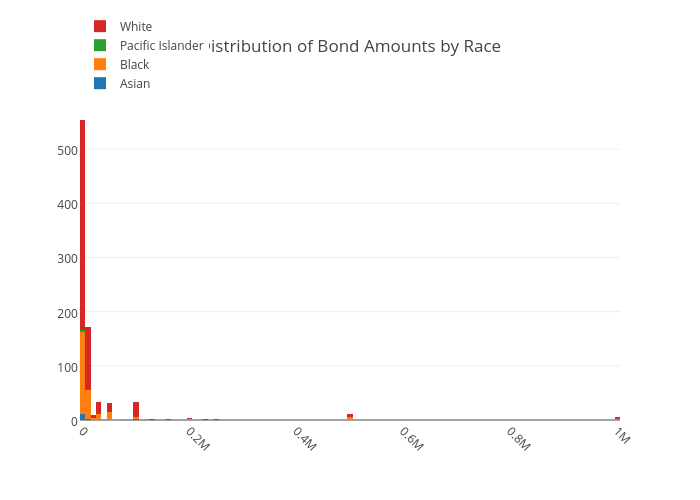
Tammylarmstrong's interactive graph and data of "Distribution of Bond Amounts by Race" is a histogram, showing Asian, Black, Pacific Islander, White. The x-axis shows values from 0 to 0. The y-axis shows values from 0 to 0.