Edit chart
Loading graph
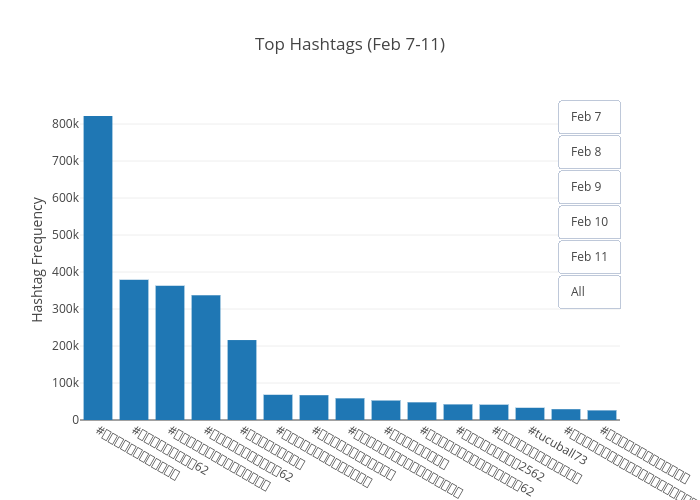
Taozaze's interactive graph and data of "Top Hashtags (Feb 7-11)" is a bar chart, showing All; with Hashtag Frequency in the y-axis. The x-axis shows values from 0 to 0. The y-axis shows values from 0 to 0.